Open Telemetry in NodeJS
This document outlines how OpenTelemetry is used within NodeJS applications. It’s goal is to give you a rough idea of how it works and how to get your code instrumented with both tracing and metrics within NodeJS/Typescript applications.
Note that this is tailored to containerised NodeJS applications, and not serverless compute like Lambda. The approach within Lambda-like environments will be slightly different.
Introduction to OpenTelemetry
So what is OpenTelemetry (OTel)? Essentially it’s an industry standard collection of tools, APIs and SDKs. You can use it to instrument your application code to collect traces and metrics which you can use to understand the applications performance and behaviour.
For a more in depth read on OTel: https://opentelemetry.io/docs/concepts/
Instrumenting your application
Before instrumenting your application you’ll want to consider what you want to collect (metrics, traces), and where you want to export your data too. This will determine which pages you’ll need!
Packages you’ll need to install:
@opentelemetry/resources@opentelemetry/semantic-conventions@opentelemetry/instrumentation@opentelemetry/sdk-trace-base@opentelemetry/sdk-trace-node@opentelemetry/exporter-trace-otlp-grpc@opentelemetry/auto-instrumentations-node
Ensure the different @opentelemetry/* packages are pinned to the same versions. There are breaking changes between them which can be very difficult to debug. Even minor patch versions contain breaking changes, do not expect the packages to follow semver.
The following example shows how to collect traces and export using OTLP with fairly minimal configuration.
import { getNodeAutoInstrumentations } from "@opentelemetry/auto-instrumentations-node";
import { OTLPTraceExporter } from "@opentelemetry/exporter-trace-otlp-grpc";
import { NodeTracerProvider } from "@opentelemetry/sdk-trace-node";
import { BatchSpanProcessor } from "@opentelemetry/sdk-trace-base";
import { registerInstrumentations } from "@opentelemetry/instrumentation";
import { Resource } from "@opentelemetry/resources";
import { SemanticResourceAttributes } from "@opentelemetry/semantic-conventions";

const openTelemetry = (serviceName: string) => {
  const resource = new Resource({
    [SemanticResourceAttributes.SERVICE_NAME]: serviceName,
  });

  const tracerProvider = new NodeTracerProvider({ resource });

  registerInstrumentations({
    tracerProvider,
    instrumentations: [
      // @see: https://www.npmjs.com/package/@opentelemetry/auto-instrumentations-node
      // for the full list of auto-instrumented packages
      getNodeAutoInstrumentations({
        "@opentelemetry/instrumentation-graphql": {
          mergeItems: true, // merges trace spans for lists: users.*.id instead of: users.0.id, users.1.id etc.
        },
        "@opentelemetry/instrumentation-http": {
          ignoreIncomingPaths: [
            // Never trace the health check.
            "/.well-known/apollo/server-health",
          ],
        },
      }),
    ],
  });

  // OTLP = OpenTelemetry Protocol. Data is sent to this address, where our OTel Collector is running.
  // In the context of the mobile graphql api we run a sidecar container that collects our otel traces.
  const otlpExporter = new OTLPTraceExporter({
    url: "http://localhost:4317",
  });

  tracerProvider.addSpanProcessor(new BatchSpanProcessor(otlpExporter));
  tracerProvider.register();

  return { tracer: tracerProvider.getTracer(serviceName) };
};

export const { tracer } = openTelemetry("rides-service");
When your nodejs application starts you’ll need to require this before anything else happens. You can do this on the CLI like so: node -r dist/open-telemetry.js dist/server.js. This ensures open-telemetry has loaded and initialised before anything else in your application and as a result means auto-instrumentation is in place and can accurately trace your application.
Now, if you wanted your traces to end up in AWS X-Ray, then you’ll want to make some additional changes:
import { getNodeAutoInstrumentations } from "@opentelemetry/auto-instrumentations-node";
import { OTLPTraceExporter } from "@opentelemetry/exporter-trace-otlp-grpc";
import { NodeTracerProvider } from "@opentelemetry/sdk-trace-node";
import { BatchSpanProcessor } from "@opentelemetry/sdk-trace-base";
import { registerInstrumentations } from "@opentelemetry/instrumentation";
import { Resource } from "@opentelemetry/resources";
import { SemanticResourceAttributes } from "@opentelemetry/semantic-conventions";
// Additional modules we'll need
+import { AWSXRayIdGenerator } from "@opentelemetry/id-generator-aws-xray";
+import { AWSXRayPropagator } from "@opentelemetry/propagator-aws-xray";

const openTelemetry = (serviceName: string) => {
  const resource = new Resource({
    [SemanticResourceAttributes.SERVICE_NAME]: serviceName,
  });

  const tracerProvider = new NodeTracerProvider({
     // Ensure the Trace ID generated matches AWS XRay format
+    idGenerator: new AWSXRayIdGenerator(),
    resource,
  });

  registerInstrumentations({
    tracerProvider,
    instrumentations: [
      getNodeAutoInstrumentations({
        "@opentelemetry/instrumentation-graphql": {
          mergeItems: true,
        },
        "@opentelemetry/instrumentation-http": {
          ignoreIncomingPaths: [
            // Never trace the health check.
            "/.well-known/apollo/server-health",
            // Never trace Prometheus metrics exporter endpoint
            "/metrics",
          ],
        },
      }),
    ],
  });

  const otlpExporter = new OTLPTraceExporter({
    url: "http://localhost:4317",
  });

  tracerProvider.addSpanProcessor(new BatchSpanProcessor(otlpExporter));
  tracerProvider.register({
+    propagator: new AWSXRayPropagator(),
  });

  return { tracer: tracerProvider.getTracer(serviceName) };
};

export const { tracer } = openTelemetry("rides-service");
Custom trace spans
With the above we will automatically be able to trace our application, but sometimes you’ll want to dig deeper and trace your own business logic. To do this we can use the exported tracer.
import { tracer } from "../open-telemetry"

// By using `startActiveSpan` we can provide a name for the span and a function that will be traced
// where the first argument is the newly creat span.
const upcomingChallenges = await tracer.startActiveSpan(
  "highlights.findUpcomingChallenge",
  async (span) => {
    // We can add additional metadata to spans, such as a User ID. Useful for debugging!
    span.setAttribute("user.id", this.context.user.id);
    try {
      return await this.findUpcomingChallenges();
    } catch (error) {
      // The error is only being caught so we can end the span in the finally block below.
      // throwing the error again allows you to handle the error outside of this instrumentation.
      // in the context of this code, the error is caught and dealth with further up the stack.
      throw error;
    } finally {
      // It's important to end the span when dealing with throwable code.
      // the startActiveSpan method will not handle this automatically if an error is thrown.
      span.end();
    }
  }
);
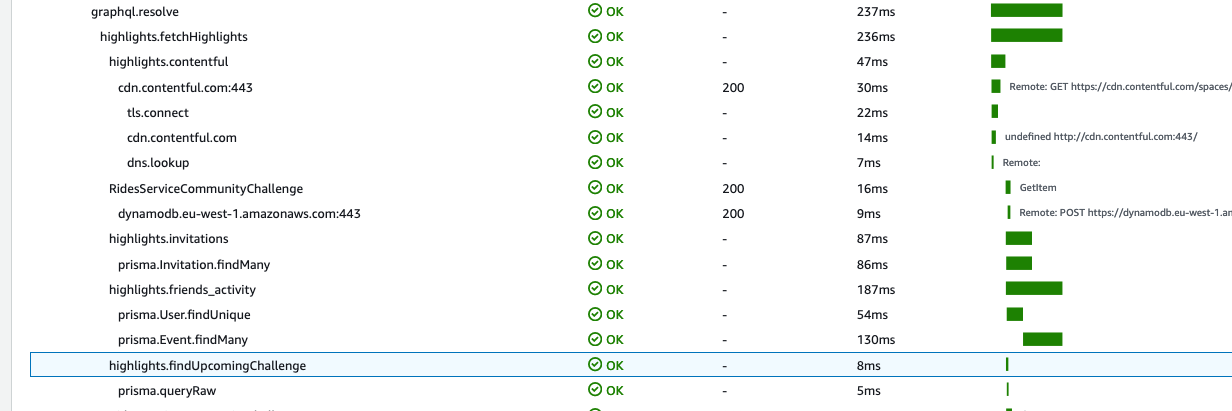
Once you have instrumented your code you’ll be able to see your span within the trace:
Collecting traces
Now that we’ve instrumented our application with traces, we need to collect them and export out to our desired destination. This example below will show you how to export to AWS X-Ray.
As mentioned above the collector is a sidecar docker container. The docker image is: otel/opentelemetry-collector-contrib and below is an example for your docker-compose.yml to run it locally:
services:
  ot-collector:
    image: otel/opentelemetry-collector-contrib:0.43.0
    command: [ "--config=/etc/otel-agent-config.yaml" ]
    environment:
      - AWS_REGION=eu-west-1
      - AWS_PROFILE=default
      - AWS_SDK_LOAD_CONFIG=true
      - AWS_SHARED_CREDENTIALS_FILE=/root/.aws/credentials
      # only needed for prometheus metrics scraping.
      - PROMETHEUS_TARGET=host.docker.internal:9464
    volumes:
      # Mounting your otel agent config. More on this below.
      - ./docker/otel-collector/otel.yaml:/etc/otel-agent-config.yaml
      # Mounting your AWS credentials. These will need to be setup correctly to use awsxray.
      - ~/.aws:/root/.aws
    ports:
      - "1777:1777" # pprof extension
      - "55679:55679" # zpages extension
      - "13133" # health_check
      - "4317:4317" # otl grpc endpoint.
      - "8888:8888"
Next up you’ll need to define the agent config for the collector, from the example above this will need to be named otel.yaml . This is how you’ll configure the collector on how to process the traces.
extensions:
  health_check:

# Defines how data is recievd. This configures the OTLP endpoints we'll send traces to.
receivers:
  otlp:
    protocols:
      grpc:
        endpoint: 0.0.0.0:4317
      http:
        endpoint: 0.0.0.0:4318
# Defines how data will be processed. Here we batch traces together.
# You could also implement sampling and other processors to drop/modify data.
processors:
  batch/traces: # note this name is namespaced. batch is the name of the processor. batch/trace is a way to define trace specific config. metrics might need different config for example.
    timeout: 1s
    send_batch_size: 50

# Configure which exporters you need.
# logging is useful for local dev.
exporters:
  logging:
    loglevel: debug
  awsxray:

# Finally you specify a pipeline and which receivers, processors and exporters
# you want to use.
service:
  pipelines:
    traces:
      receivers: [otlp]
      processors: [batch/traces]
      exporters: [awsxray] # locally you could change this to: [awsxray,logging], then tail the docker logs to see the traces.
  extensions: [health_check]
More examples
To see how metrics are implemented and how they are exported to Grafana you can take a look at the Mobile rides-service repository:
- Dockerfile showing how the service is started with Open Telemetry
- Full docker-compose example, including ECS local endpoints support (used to emulate ECS api endpoints to get instance ids)
- Custom OTel Collector Docker image for supporting ECS
- Also see the otel agent config: https://gitlab.com/rapharacing/rapha-mobile/rides-service/-/blob/master/docker/otel-collector/otel.yaml
- Complete Tracing and Metric configuration in Typescript:
- Instrumentation code: https://gitlab.com/rapharacing/rapha-mobile/rides-service/-/blob/master/api/src/open-telemetry.ts
- Defined metrics: https://gitlab.com/rapharacing/rapha-mobile/rides-service/-/blob/master/api/src/tracing/utils.ts
- Apollo Server Plugin for creating duration metric for resolvers: https://gitlab.com/rapharacing/rapha-mobile/rides-service/-/blob/master/api/src/plugins/Metrics.ts